Concepts in Load Application and Stressing
Some general concepts in structural assessment are described in this feature including categories of load, failure modes and uncertainty. The majority of structural assessments compare a peak predicted stress from a structural simulation, with an allowable stress obtained from material standards, design standards or codes of practice. Linear elastic stress analysis is commonly used to evaluate if a structure is adequate under various loadings, even as an approximation for cases that may cause proof or ultimate stresses to arise. Ideas for dealing with random variation in analysis inputs (also known as uncertainty or stochastics) is discussed, which is increasingly recognised as an important topic in some fields of simulation.
The working stress approach is used commonly throughout the mechanical engineering industries. This is characterised by predicted stresses determined from calculations or an FE model being compared with an allowable stress, reduced by a single appropriate safety factor.
The limit state design approach, often used in building structural design and naval architecture, is by contrast, characterised by the use of more specific ‘partial’ safety factors, which are then combined into a global safety factor. The applied loads are often termed the ‘demand’ and give rise to what analysts often call predicted stresses. The resistance to failure is provided by material strength and structural properties, is termed the ‘capacity’ and in a simulation, is represented by a limiting or allowable stress. Both the demand and capacity represent inputs to a numerical simulation and are multiplied or divided (as appropriate) by individual (partial) safety factors. Partial safety factors can represent uncertainty in the structure and loading conditions, albeit crudely, and could even account for the degree of seriousness of failure.
The term uncertainty or variability used here is the same as that introduced in previous Knowledge Base articles, describing the SAFESA approach to structural qualification. A definition of error in structural analysis was also introduced, meaning the accuracy of an FE model of the structure. In a limit state approach, a further partial safety factor could be assigned specifically to account for this.
Four types of limit state are normally considered and are defined by the conditions under which the structure is assessed:
- Ultimate limit state – It must be shown that the structure will not collapse when subjected to the most severe loads it can be expected to encounter. Consideration must be given to localised or extensive failure through fracture, plastic collapse or buckling instability.
- Serviceability limit state – Subject to normal service loads, a state at which deformation, appearance or condition of the structure becomes unacceptable but doesn’t usually involve collapse. General examples are if the floors of a building deflect or vibrate too much, objects or people may be at risk.
- Fatigue limit state – collapse must not occur under repeated application of service loads over the life cycle of the structure. This is perhaps the most important limit state in many mechanical engineering applications, although it is not usually considered in the construction or building standards.
The limit state approach allows partial safety factors to be used to account for variability in all inputs to a simulation; effectively using worst-case values of each input. Although account is sometimes taken of the likelihood of a worst-case value occurring (eg, if the shape of the normal distribution curve is known for a variable, an analyst might choose to work directly with the 2% failure probability stress) the probability of all such worst case events occurring together is not considered. Combining several worst-case inputs together in an analysis, each with a low probability of occurring can result in a simulation of an event that has a near zero probability. This is arguably why such approaches often result in overly conservative designs and perhaps why attention is increasingly focussed on methods of better-representing randomness in simulation.

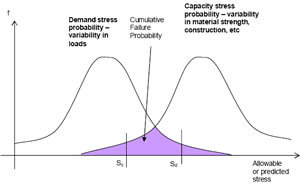
The figure above illustrates the overlap of two assumed normal probability distributions of stress, for demand and capacity at a critical point in a structure. (This is a simplification: there could be a probability distribution for each input to the simulation.) It can be seen that the mean stresses, corresponding to the mid-points of each normal distribution curve, are separated by a good margin. Conventional approaches might account for uncertainty by specifying worst case demand and capacity stresses of Sd and Sc respectively.
We would then look to the simulation to show that Sd is less than Sc, for an acceptable design, which in this case is not satisfied. The figure attempts to illustrate that using safety factors to account for statistical variation in this way can be too conservative. The shaded portion indicates the cumulative probability of failure, which might be allowable at this point in the structure, despite the worst case stresses indicating the design is inadequate. So, an improved method would attempt to quantify this cumulative probability and perhaps establish whether it is allowable. This will be discussed further in the next article: Probabilistic Analysis.
Go to the next Knowledge Base article: Probabilistic Analysis or go back to Knowledge Base article series list


